量化交易的开源回测框架中, Zipline 应该是最流行的,国内也有不少模仿Zipline 的回测框架存在,甚至可以说国内开源或商业化回测平台,几乎都是模仿Zipline和Quantopian。Zipline模式似乎成了业界标杆,但是对于普通开发者入手难度并不低。数据注入(Ingest),data bundle管理异常麻烦,对比各个开源回测工具,我发现 Backtrader 非常灵活,上手难度也很低,也能满足大部分普通回测场景的需求。这篇博客,介绍我使用本地数据库,利用Backtrader进行单资产回测的经验。
均线交叉策略回测单个资产
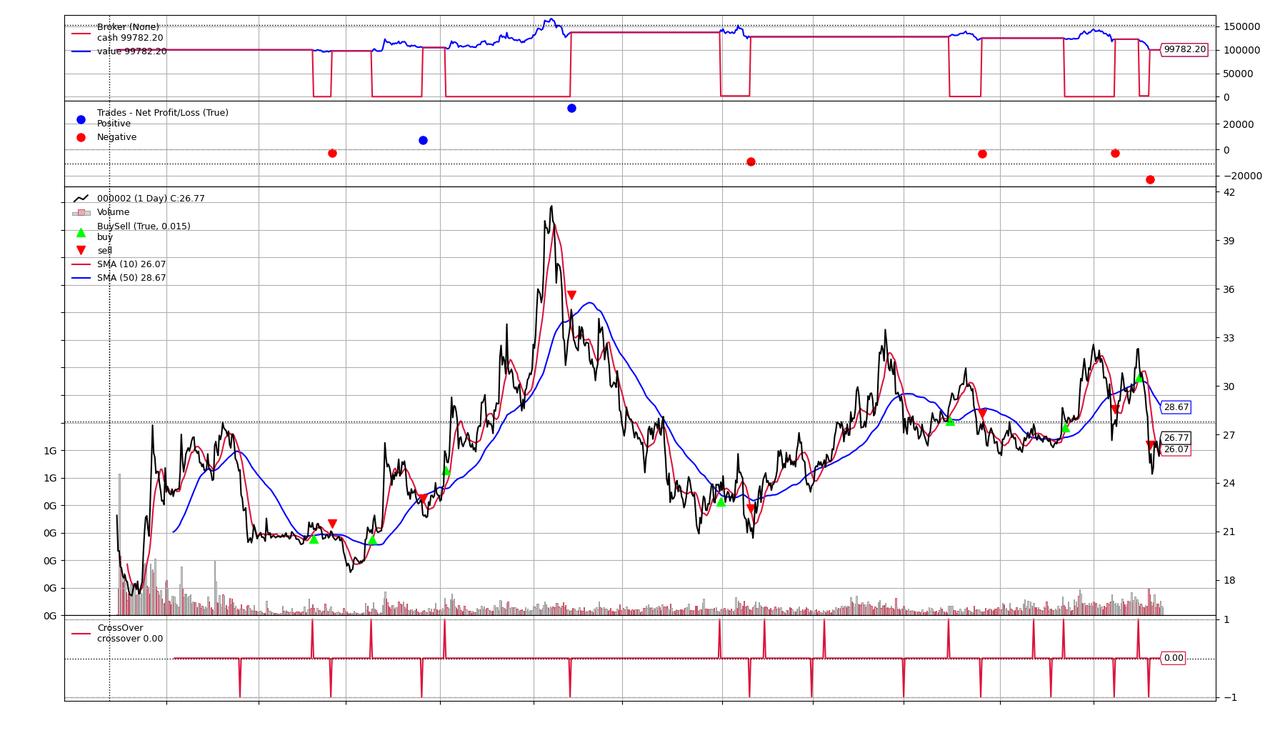
均线交叉 是一种非常常见的交易策略,在量化和非量化交易中应用广泛。这里我选择的长周期均线是50日MA,短周期均线是10日MA,当10日均线上穿50日均线买入,10日均线下穿50日均线则卖出。回测对象是2016年1月1日到本周五(2020年4月3日)的 万科(000002) ,数据来源是本地数据库中存储的日行情表。
准备
python3, 自2020年1月,PSF已经停止维护python3以下的版本,你必须要在本地安装Python3.6或以上版本。当然也可选择安装最新版的annaconda发行版。确认安装好Python后,在命令行执行python可以进入交互式命令行环境,运行 pip 确认安装成功。
安装软件包, pip install backtrader[plotting] sqlalchemy psycopg2 安装backtrader到你的开发环境。sqlalchemy用于数据库操作,psycopg2是postgresql的Python连接驱动。
logging, 代码中使用Python标准款logging来打印日志,需要了解Python中如何 配置logging 。
使用本地数据库
相比Zipline,Backtrader可以轻易地集成任何数据格式,这里我使用Postgresql数据库中存储的日行情表作为数据源提取数据,数据格式如下表:
| date | symbol | open | high | low | close | volume |
|---|---|---|---|---|---|---|
| 2020-04-03 | 000002 | 26.75 | 27.18 | 26.60 | 26.77 | 56945280 |
| 2020-04-02 | 000002 | 26.50 | 26.94 | 26.35 | 26.88 | 663097380 |
| 2020-04-01 | 000002 | 26.45 | 26.96 | 26.25 | 26.63 | 107433164 |
参考 文档 ,编写自定义的的DataFeed,DataFeed执行SQL从本地数据库抽取日行情,策略代码将使用这个创建的DataFeed来获取数据。
下面是我们的代码
import logging
import datetime
from typing import Iterator, List, Tuple

import backtrader as bt
from sqlalchemy.engine import Engine, create_engine

log = logging.getLogger(__name__)


class DBDataFeed(bt.feed.DataBase):
    symbol: str
    historical_eod: Iterator
    engine: Engine = None

    params = (
        ("dataname", None),
        ("fromdate", datetime.date(2000, 1, 1)),
        ("todate", datetime.date(2050, 1, 1)),
        ("compression", 1),
        ("timeframe", bt.TimeFrame.Days),
        ("symbol", None),
    )

    def __init__(self, db_uri, *args, **kwargs):
        # db_uri sqlalchemy文档:
        #   https://docs.sqlalchemy.org/en/13/core/engines.html
        super(*args, **kwargs)
        self.db_uri = db_uri

        self.symbol = self.p.dataname

    def start(self):
        super().start()

        if not self.engine:
            log.info("initialize db connection: {}".format(self.db_uri))
            self.__class__.engine = create_engine(self.db_uri)

        # 从数据库load准备数据
        sql = """
            SELECT "date" AS DATETIME
                , "open"
                , high
                , low
                , "close"
                , volume
            FROM cn.historical_daily
            WHERE symbol = '{}'
                AND "open" > 0
                AND high > 0
                AND low > 0
                AND "close" > 0
                AND volume > 0
                AND "date" >= %s
                AND "date" <= %s
            """.format(self.symbol)
        rp = self.engine.execute(sql, (self.p.fromdate, self.p.todate))
        historical_eod = list(rp.fetchall())
        historical_eod.sort(key=lambda x: x.datetime)
        self.historical_eod = iter(historical_eod)

        log.info(
            "load {} rows for {}".format(len(historical_eod), self.symbol)
        )

    def stop(self):
        pass

    def _load(self):
        # 实现 datafeed 的iterator接口函数
        try:
            row = next(self.historical_eod)
        except StopIteration:
            return False

        self.lines.datetime[0] = bt.date2num(row.datetime)
        self.lines.open[0] = float(row.open)
        self.lines.high[0] = float(row.high)
        self.lines.low[0] = float(row.low)
        self.lines.close[0] = float(row.close)
        self.lines.volume[0] = float(row.volume)
        self.lines.openinterest[0] = 0

        return True
编写策略代码
策略代码本身很简单,但需要先了解几个概念:
Broker,Broker中文含义是经纪人,通常代指我们的券商。回测是模拟交易,需要有一个执行交易的模拟Broker,代码中没有指定Broker,默认使用 backtrader.brokers.BackBroker ,调用 broker.buy 或 broker.sell 时会使用下一个交易日的 open price 成交。
Sizer,回测过程中,如果执行买卖操作时没有指定买卖目标数量,Sizer会用于计算买卖数量。代码中使用 AllInSizerInt ,表示若没有买卖目标数量,那么执行全仓买入或卖出。
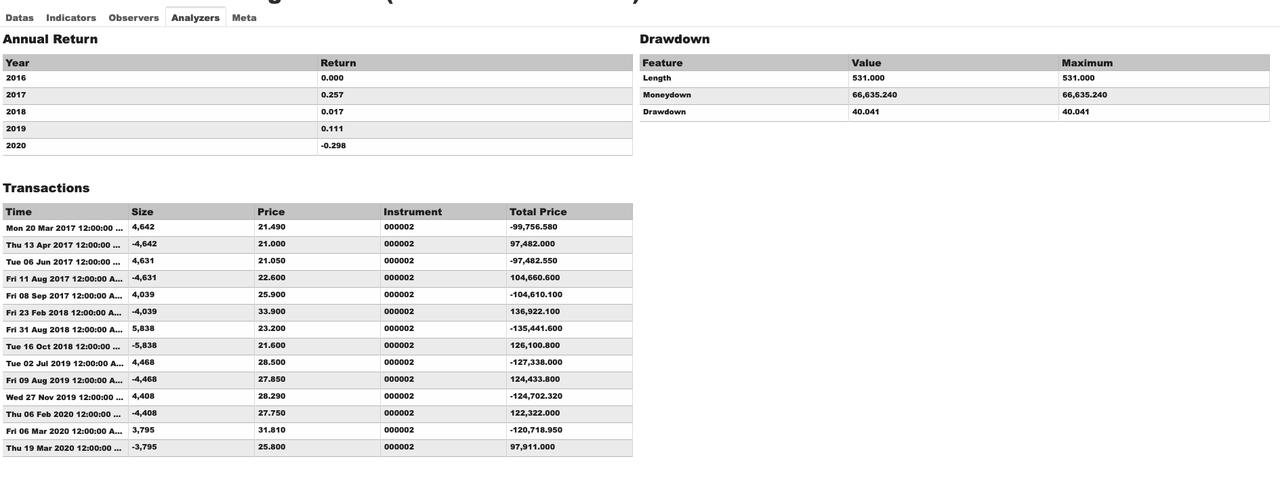
Analyzer,对回测进行分析非常重要,Backtrader提供多种分析器,代码中使用的分析器是 1)年度收益统计,2)回撤分析,3)交易记录表。
策略回测代码
import datetime

class SMACross(bt.Strategy):
    params = dict(
        sma_lower=10,  # period for lower SMA
        sma_higher=50,  # period for higher SMA
    )

    def __init__(self):
        # 10日SMA计算
        sma1 = bt.ind.SMA(period=self.p.sma_lower)
        # 50日SMA计算
        sma2 = bt.ind.SMA(period=self.p.sma_higher)

        # 均线交叉, 1是上穿,-1是下穿
        self.crossover = bt.ind.CrossOver(sma1, sma2)

    def next(self):
        close = self.data.close[0]
        date = self.data.datetime.date(0)
        if not self.position:
            if self.crossover > 0:
                log.info("buy created at {} - {}".format(date, close))
                self.buy()

        elif self.crossover < 0:
            log.info("sell created at {} - {}".format(date, close))
            self.close()


if __name__ == "__main__":
    cerebro = bt.Cerebro()

    data = DBDataFeed(
        # 本地postgresql数据库
        db_uri="postgresql://user:password@localhost:5432/dbname",
        dataname="000002",
        fromdate=datetime.date(2016, 1, 1),
    )
    cerebro.adddata(data)

    cerebro.addstrategy(SMACross)
    cerebro.addsizer(bt.sizers.AllInSizerInt)
    cerebro.broker.set_cash(100000)

    cerebro.addanalyzer(bt.analyzers.AnnualReturn, _name="annual_returns")
    cerebro.addanalyzer(bt.analyzers.DrawDown, _name="draw_down")
    cerebro.addanalyzer(bt.analyzers.Transactions, _name="transactions")

    results = cerebro.run()

    # 打印Analyzer结果到日志
    for result in results:

        annual_returns = result.analyzers.annual_returns.get_analysis()
        log.info("annual returns:")
        for year, ret in annual_returns.items():
            log.info("\t {} {}%, ".format(year, round(ret * 100, 2)))

        draw_down = result.analyzers.draw_down.get_analysis()
        log.info(
            "drawdown={drawdown}%, moneydown={moneydown}, drawdown len={len}, "
            "max.drawdown={max.drawdown}, max.moneydown={max.moneydown}, "
            "max.len={max.len}".format(**draw_down)
        )

        transactions = result.analyzers.transactions.get_analysis()
        log.info("transactions")

    # 运行结果绘图
    cerebro.plot()
运行Python代码
| Year | Return |
|---|---|
| 2016 | 0.0% |
| 2017 | 25.7% |
| 2018 | 1.7% |
| 2019 | 11.1% |
| 2020 | -29.8% |
策略运行结果plotting图

使用backtrader_plotting
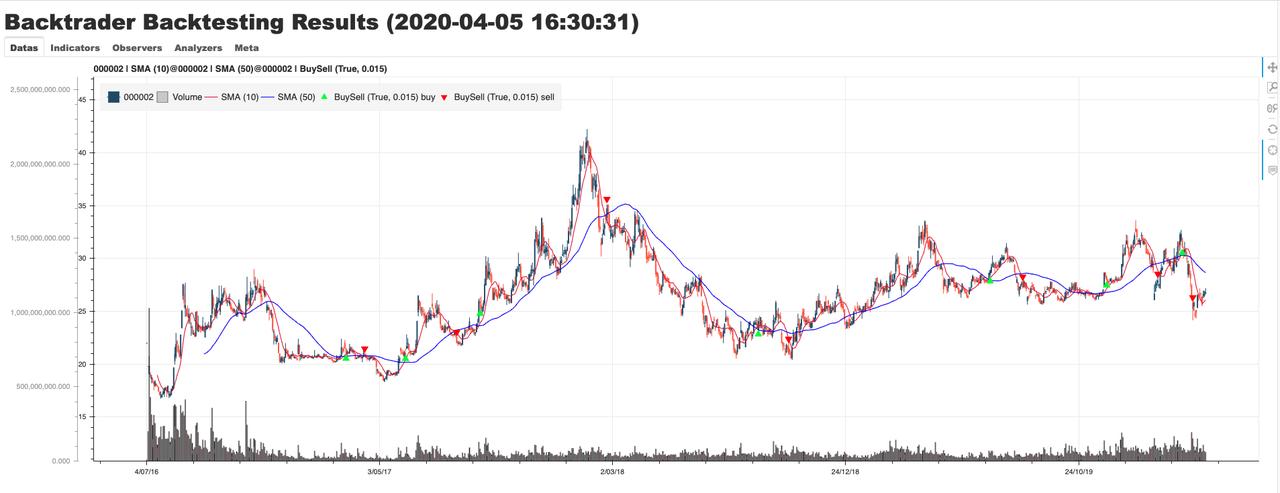
Backtrader自带的plotting图形阅读效果和稳定性都较差,建议使用社区开发的基于web的plotting插件: backtrader_plotting 方便读图和分析。
pip install backtrader_plotting 安装插件。
修改代码,在代码文件顶部引入backtrader_plotting
from backtrader_plotting import Bokeh
from backtrader_plotting.schemes import Tradimo
修改代码最后一行代码,使用backtrader_plotting替换自带默认plotting
# cerebro.plot()
b = Bokeh(style="bar", tabs="multi", scheme=Tradimo())
cerebro.plot(b)
再次运行回测代码,查看效果


总结
Backtrader单资产测试的代码量少,可读性高,扩展性高。配合backtrader_plotting,应该能满足大部分开发需求。后面还要思考的是:
1)如何处理股份拆并和配送,以及现金分红
2)如何进行多资产回测
3)如何对回测数据进行更多维度的分析
4)如何对接实盘交易

This work is licensed under a Creative Commons Attribution-NonCommercial-ShareAlike 4.0 International License.